Interpret Classification Results Using Rosepetal
This tutorial explains how to interpret classification results within the Rosepetal application
1. Metrics and matrix
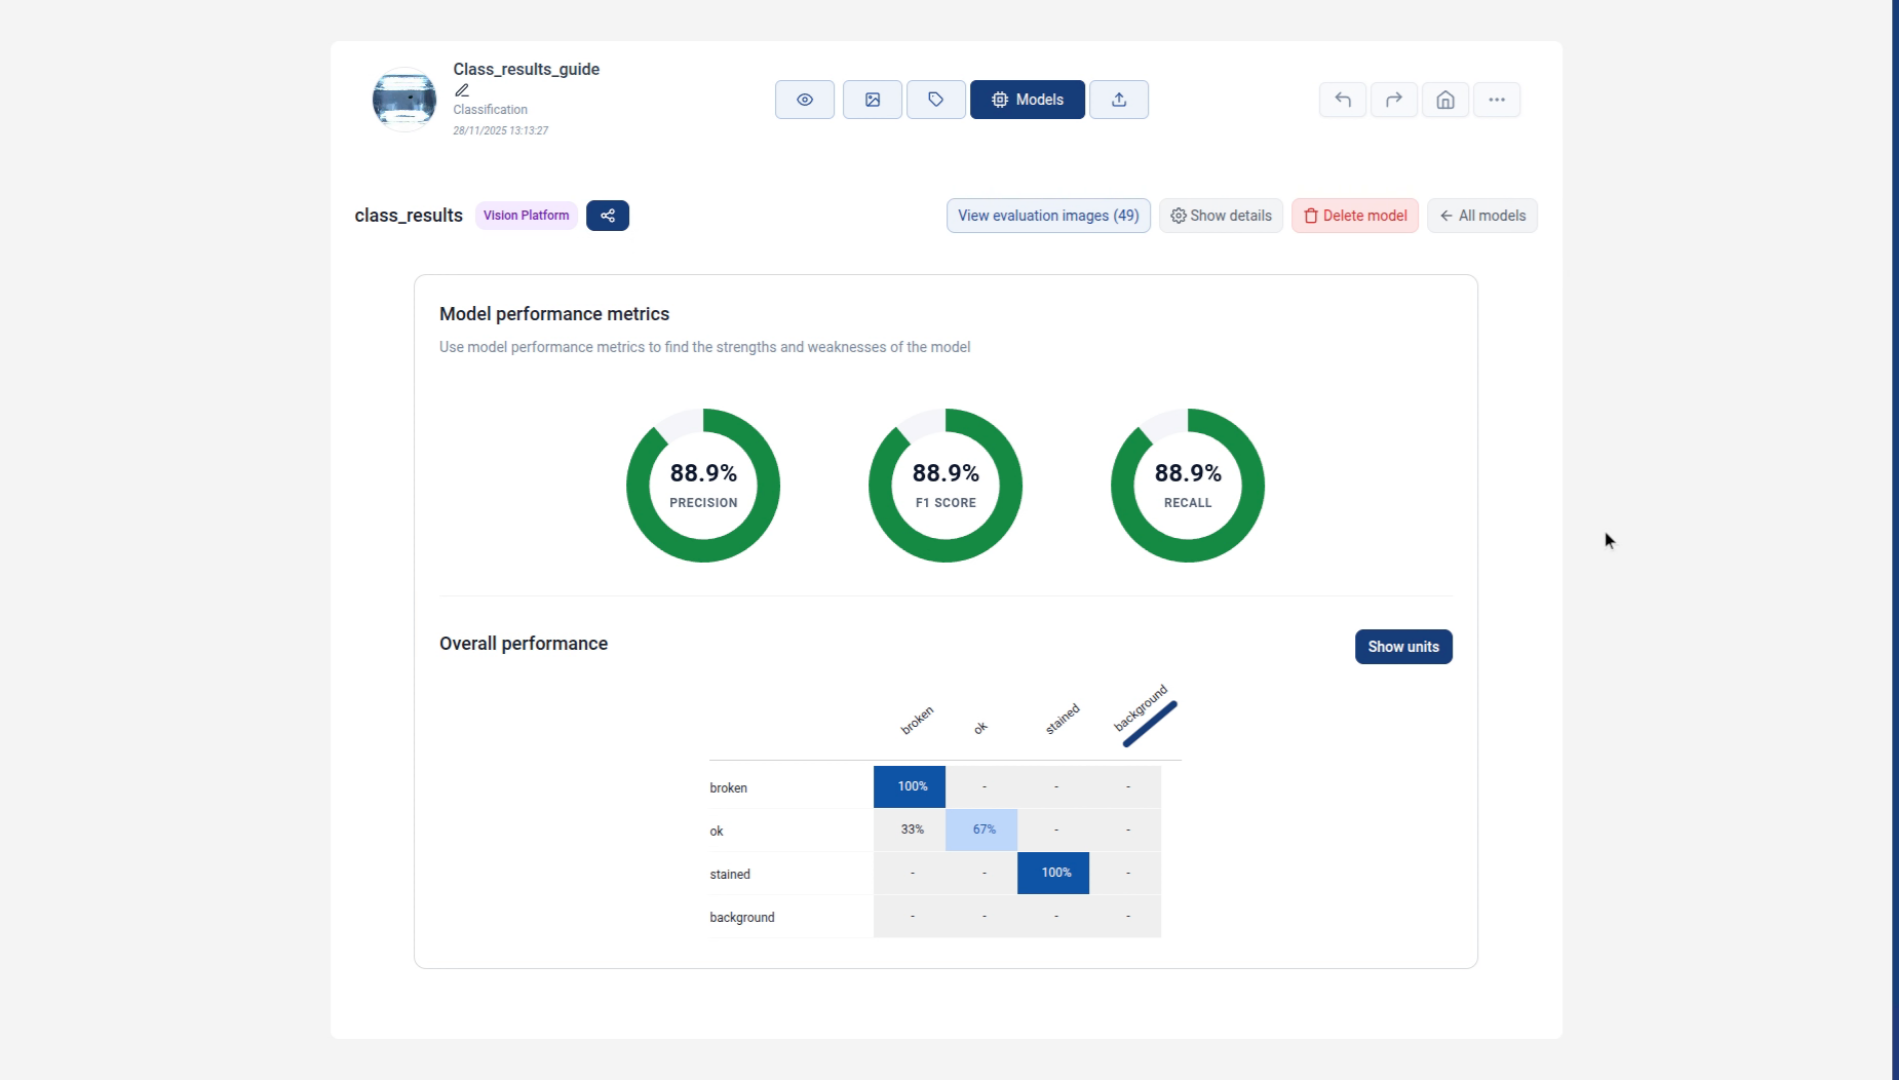
You will learn how to analyze classification outcomes effectively. The first thing we see are the 3 main metrics obtained by the model. Precision indicates how often the predicted class is correct, recall indicates how often each class is correctly identified, and f1-score indicates their harmonic balance for each class. At the moment of the recording of this guide, the platform only allows the training of multiclass models, but not multilabel, which means that, for each image, it can only have assigned one class. For instance, in this dataset, an image can be labelled as ok, broken or stained, but not stained and broken at the same time. This is important since multiclass models will always have the same precision, recall and f1-score since each error affects precision and recall equally, which might not be the case with other models. Despite that, these 3 metrics provide a general overview of the model's performance, but lack insight on the specific performance of each class. For that, we use the confusion matrix. Rows show the true class while columns show the predicted class. Therefore, the ideal matrix has all values on the main diagonal (top-left to bottom-right). In our example, the model predicts everything correctly except one ok image that is misclassified as broken. For now, you can ignore the background class since it's only useful for multilabel classification, which is not yet available
2. Click Show Units
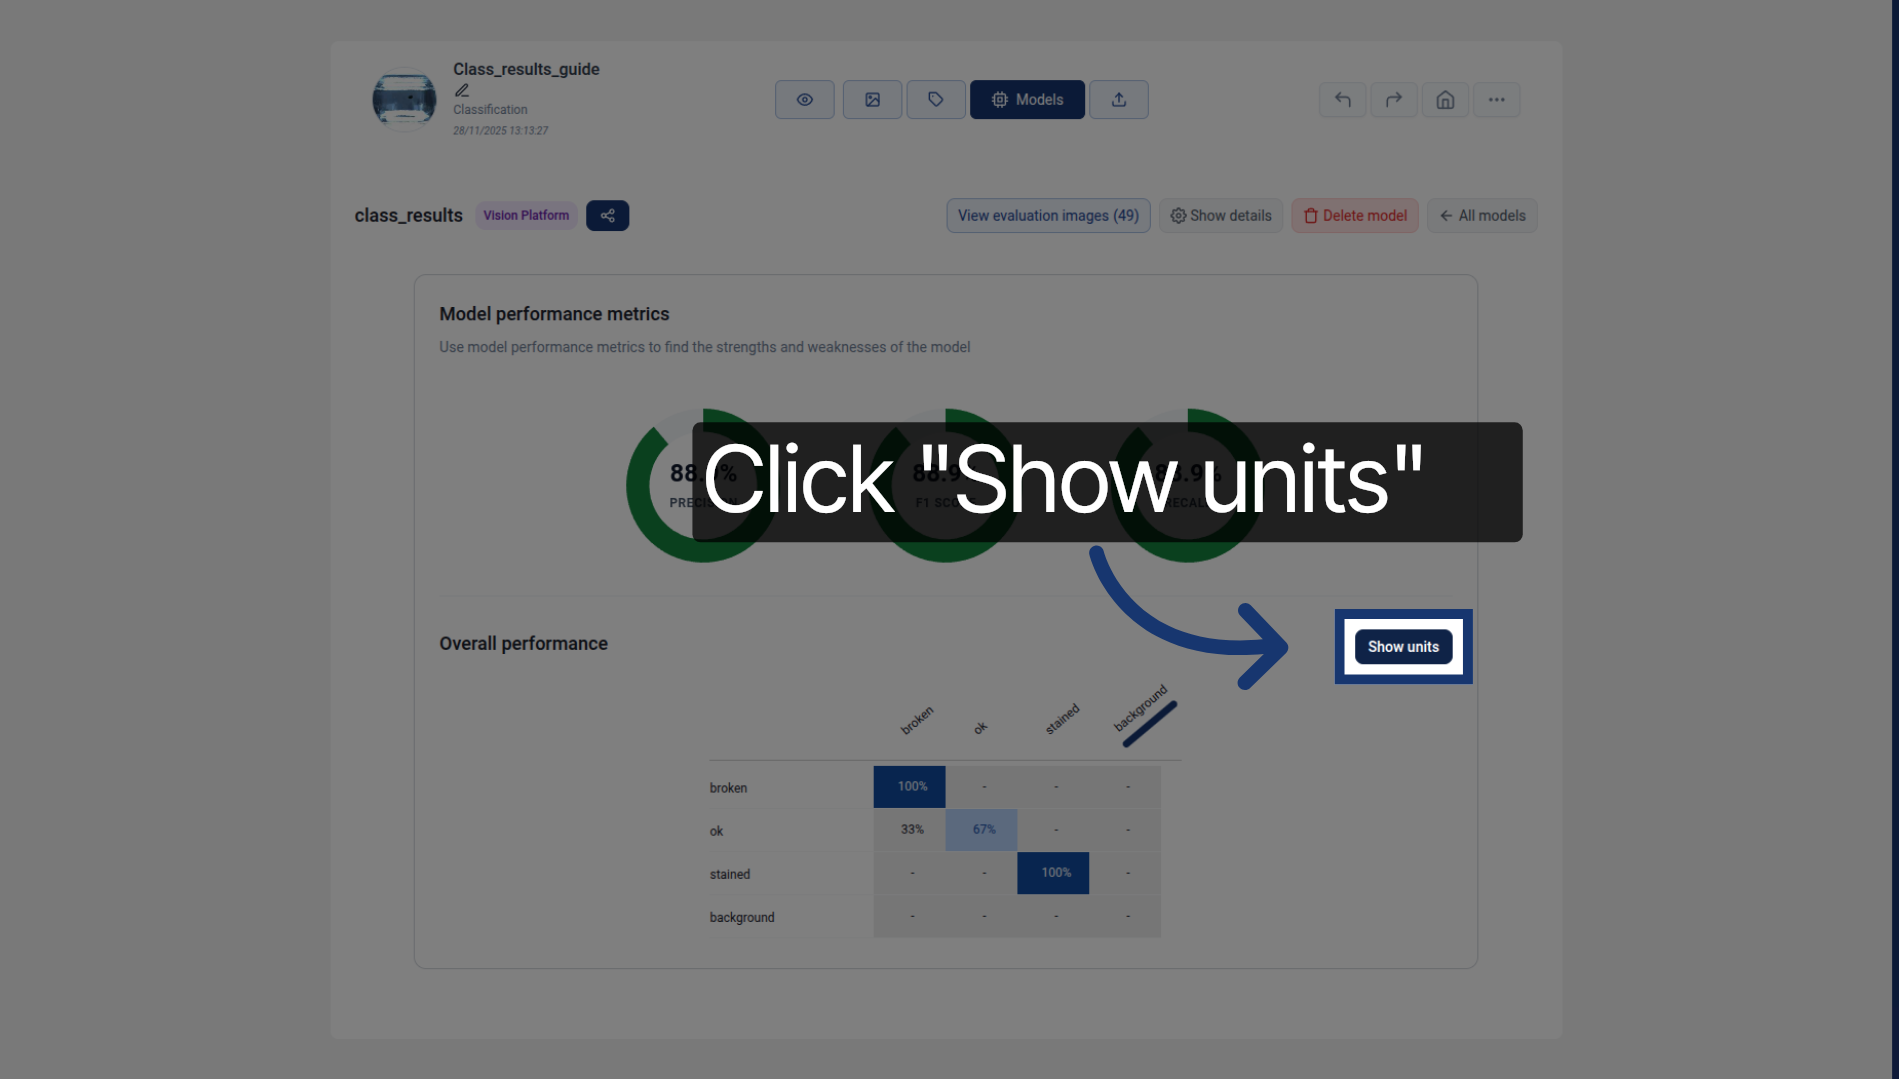
Clicking the show units button allows the matrix to be displayed in absolute values instead of percentages
3. View Evaluation Images
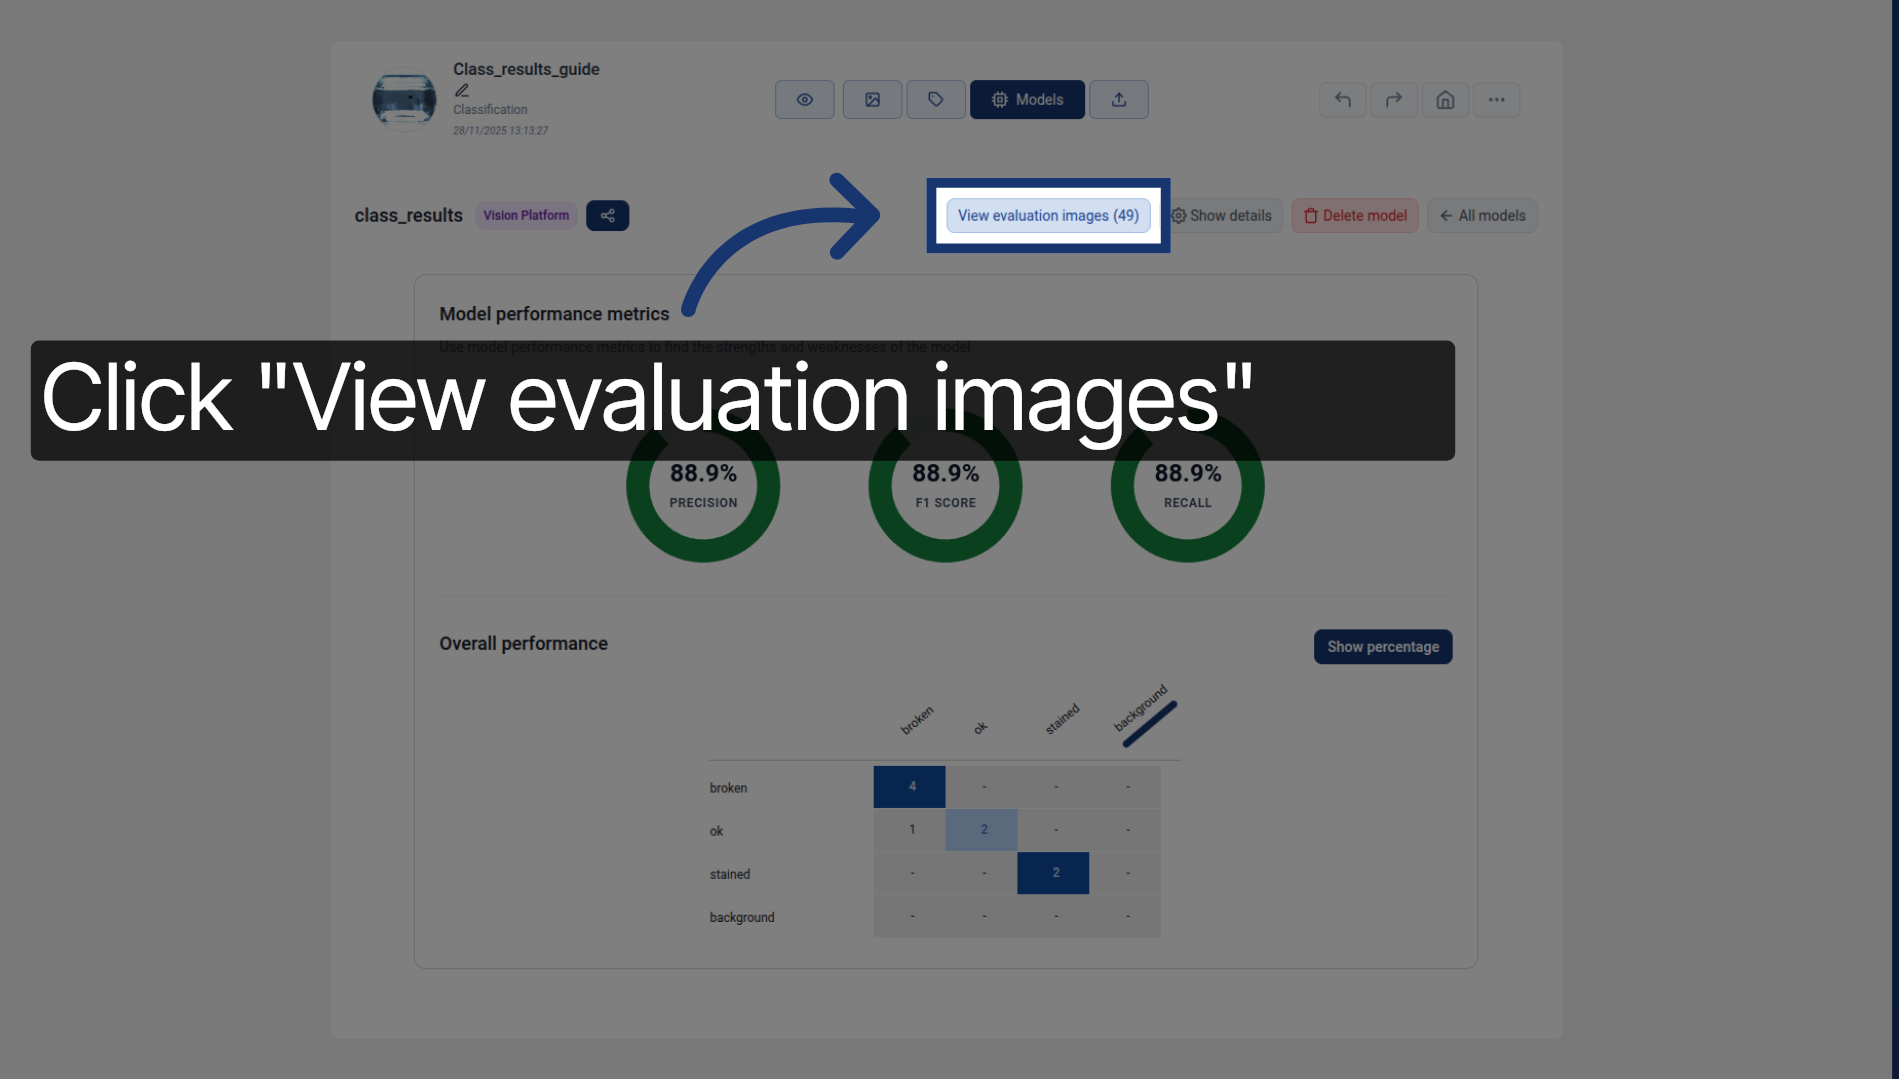
If you want more insight on the specific images that the model predicted correctly or incorrectly, you can click View evaluation images to open the set of images used for evaluating the model. This is particularly useful to identify which images might be problematic for the model.
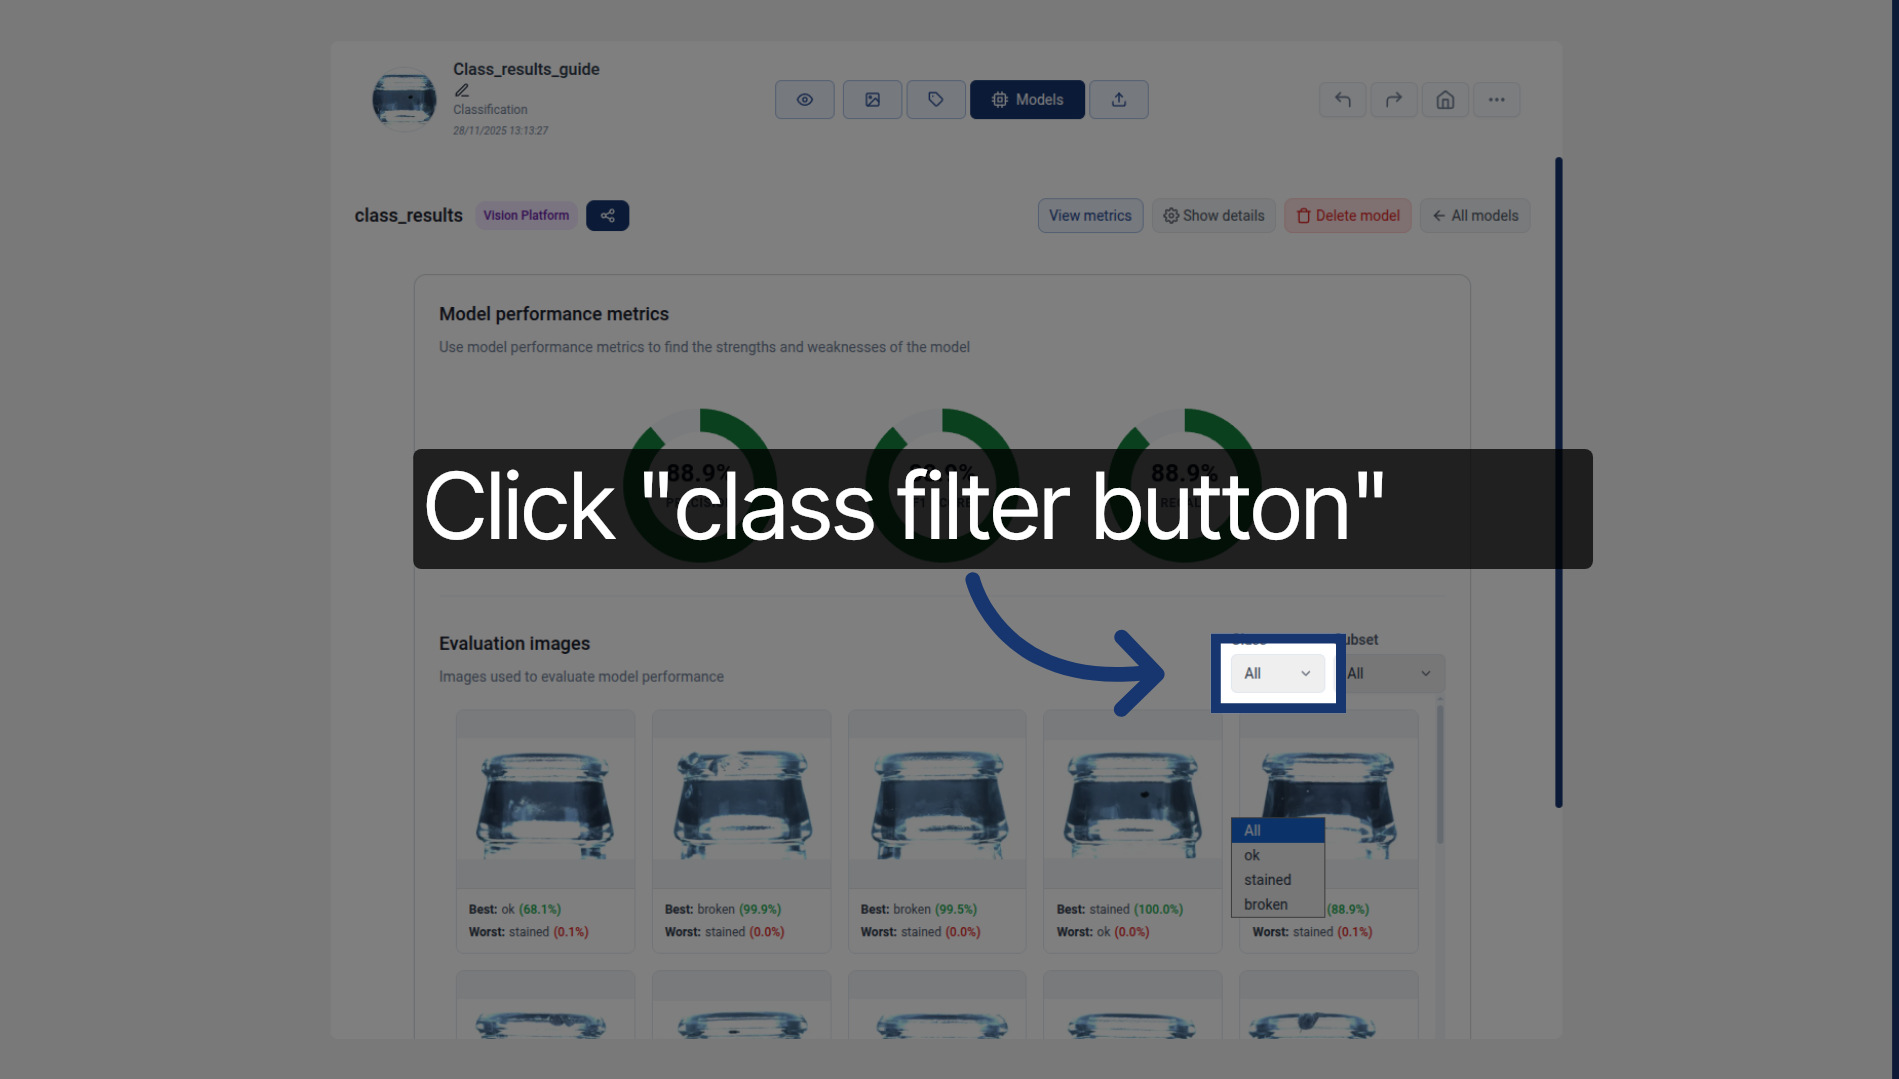
4. Select Specific Dataset
Click the class filtering button to narrow down the selection to the images that the model predicted that belonged to a certain class.
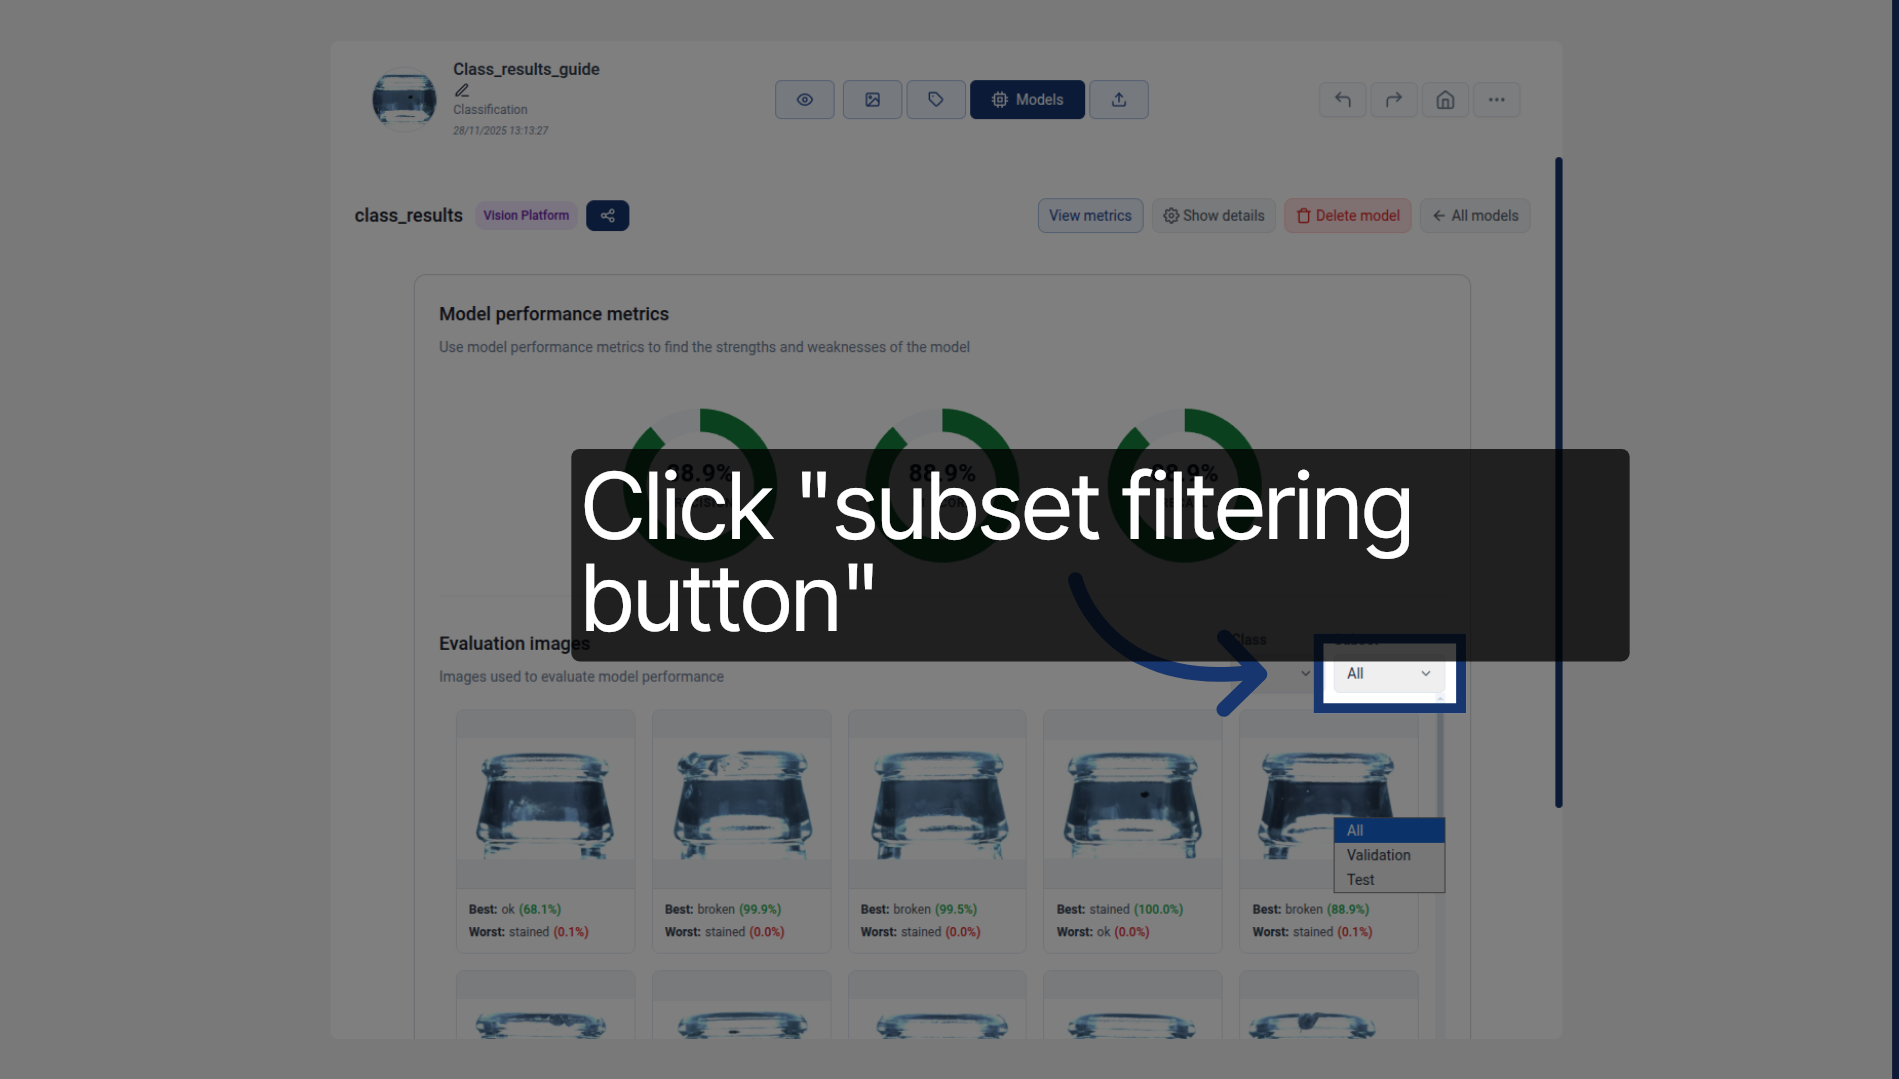
5. Choose Validation Test
Click the subset filtering button to narrow down the selection to the images belonging to a certain subset.