

Chart Bar
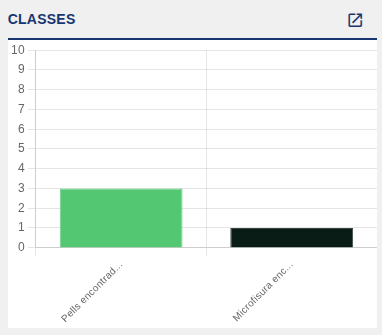
The Chart Bar node is a bar chart widget for Node-RED Dashboard 2. It displays numeric data as bars, with customisable colours, automatic label rotation and a fullscreen view.
It accepts data as simple key-value pairs or as objects with a value and an optional colour. When no colour is specified, the node automatically generates a unique, consistent colour based on the label name.
Features
- Bar layout: displays numeric data as vertical columns or horizontal rows.
- Custom colours: supports custom colours for each bar in hexadecimal (#FF0000) or RGB (rgb(255,0,0)) format.
- Automatic colour generation: generates unique, consistent colours based on the label name when none is specified.
- Label rotation: automatically rotates the labels (45-90 degrees) to improve readability when they are long.
- Label truncation: automatically truncates long labels (15 characters maximum) adding an ellipsis.
- Auto-scaling: the Y axis adjusts automatically to the data values (starting at 0).
- Fullscreen mode: click the icon in the chart header to view it in a fullscreen dialog.
- Tooltips: hovering over a bar shows detailed information (label and value).
- Responsive layout: the chart adapts to the container size and keeps its aspect ratio.
- Reset function: send
"reset"to clear all the chart data.
Configuration
| Property | Description | Default |
|---|---|---|
| Name | Node name shown in the editor. | '' |
| Group | Dashboard group where the chart is displayed. | (required) |
| Size | Widget width and height (0 = fit automatically to the group). | 0 / 0 |
| Chart title | Title shown at the top of the chart. | 'BAR CHART' |
| Bar layout | Bar layout: vertical columns (columns) or horizontal rows (rows). | 'columns' |
Input
This node has 1 input. Data is sent in the msg.payload field and is accepted in two formats.
Format 1: simple key-value pairs. The colours are generated automatically from the label name.
msg.payload = {
    "Label 1": 42,
    "Label 2": 35,
    "Label 3": 28
};Format 2: objects with a value and an optional colour. The colour can be given in hexadecimal (#RRGGBB) or RGB (rgb(r,g,b)) format. Both formats can be mixed: some bars with a custom colour and others without one.
The color property is optional: when it is omitted, as in "Label 2", the colour is generated automatically from the label name.
msg.payload = {
    "Label 1": {
        value: 42,
        color: "#FF0000"
    },
    "Label 2": {
        value: 35
    },
    "Label 3": {
        value: 28,
        color: "rgb(0,255,0)"
    }
};Reset. Send the string "reset" to clear all the chart data and return it to its initial state.
msg.payload = "reset";Output
This node has 1 output. It forwards the same message it receives, which allows it to be chained with other nodes.
Usage example
Simple example with automatic colours:
msg.payload = {
    "January": 120,
    "February": 150,
    "March": 180,
    "April": 200
};Example with custom colours:
msg.payload = {
    "Sales": { value: 5000, color: "#4CAF50" },
    "Costs": { value: 3000, color: "#F44336" },
    "Profit": { value: 2000, color: "#2196F3" }
};Mixed format: "Product A" and "Product C" set their colour, while "Product B" uses an automatically generated one.
msg.payload = {
    "Product A": { value: 150, color: "#FF5722" },
    "Product B": 200,
    "Product C": { value: 175, color: "rgb(33,150,243)" }
};