

Chart Pie
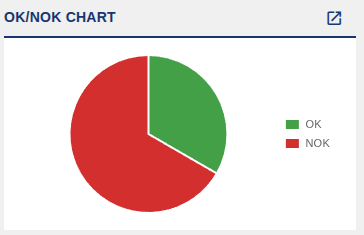
The ui-chart-pie node provides a pie chart display component based on Chart.js. It shows data in a circular statistical graphic divided into slices that illustrate the numerical proportion of each category.
It is a display-only widget: it renders the slices proportionally to their values, generates colours automatically when none are given, and shows the percentages in the tooltips on hover.
Features
- Interactive pie chart: Based on Chart.js with smooth animations.
- Automatic colour generation: Generates consistent slice colours when none are provided, using a hash function over the labels.
- Percentage calculation: Shows the percentages in the tooltips.
- Responsive layout: Automatically adapts to the size of its container.
- Fullscreen mode: Expand button for a detailed view.
- Configurable legend: Lets you show or hide the legend on the right-hand side.
- Customisable title: Lets you define your own chart title.
- Hover interactions: Detailed information when hovering over the slices.
Configuration
| Property | Description | Default |
|---|---|---|
| Name | Node name shown in the editor. | '' |
| Group | Dashboard group where the chart is displayed. | (required) |
| Size | Widget width and height (0 = fit automatically to the group). | 0 / 0 |
| Title | Text shown in the chart header. | PIE CHART |
| Show Legend | Shows or hides the legend on the right-hand side of the chart. | true |
Input
The node has 1 input. msg.payload must be an object with the chart data:
- labels: Array of strings with the name of each slice.
- values: Array of numbers with the value of each slice.
- colors: (Optional) Array of strings with the colour of each slice in any valid CSS format (hex, rgb, and so on). If not provided, the colours are generated automatically.
msg.payload = {
    labels: ['Category A', 'Category B', 'Category C'],
    values: [30, 50, 20],
    colors: ['#FF6384', '#36A2EB', '#FFCE56']
};The labels and values arrays must have the same length and the values must be numeric. If the colors array is provided, it must match labels and values in length.
Output
The node declares 1 output, but it behaves as a display-only component that renders the pie chart. In practice it does not emit data messages as a result of its rendering.
Usage example
Basic usage, letting the colours be generated automatically:
msg.payload = {
    labels: ['Category A', 'Category B', 'Category C'],
    values: [30, 50, 20]
};
return msg;Usage with custom colours:
msg.payload = {
    labels: ['Red', 'Blue', 'Yellow'],
    values: [40, 35, 25],
    colors: ['#FF6384', '#36A2EB', '#FFCE56']
};
return msg;