

Canvas Fabric
The Canvas Fabric widget displays images with advanced interactive features: zoom, pan, brightness control and optional overlays for bounding boxes, masks and segmentation polygons. It is built on a Fabric.js canvas and supports several image types with dynamic canvas switching and a fullscreen mode.
Each image type keeps its own canvas and its own viewport transform (zoom and position), which lets you switch between different views of the same inspection while preserving the state. It also offers configurable top and bottom bars with brightness controls, zoom reset, fullscreen and visibility toggles for masks, boxes, annotations and polygons.
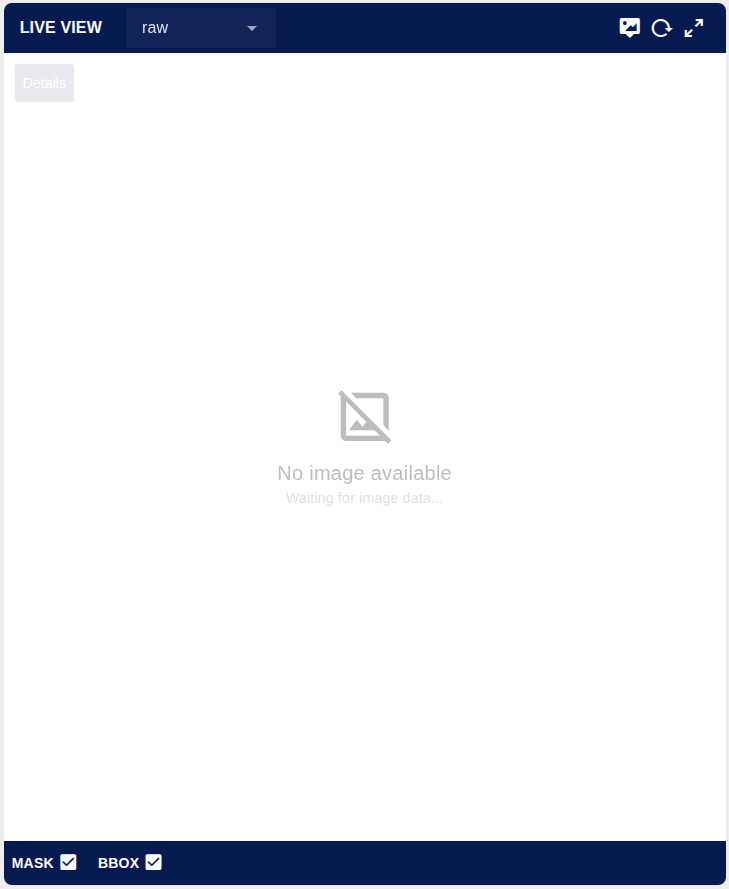
Features
- Advanced canvas: interactive zoom and pan with the mouse wheel and touch gestures.
- Multiple image types: dynamic image type selection through configurable types.
- Bounding box overlay: visual highlighting of detected objects or regions, with customisable colour and label.
- Polygon overlay: semi-transparent filled polygons for segmentation masks.
- Mask toggle: optional mask overlay for image analysis.
- Result card: optional display of the analysis status (OK/NOK or a custom label) with colour-coded cards.
- Fullscreen mode: fullscreen display with viewport state preservation.
- Brightness filter: real-time brightness adjustment (range -1 to 1).
- Canvas capture: automatic capture of the canvas as an image, sent to the output.
Configuration
| Property | Description | Default |
|---|---|---|
| Name | Node name shown in the editor. | "" |
| Group | Dashboard group where the widget is displayed. | — (required) |
| Size | Widget width and height (0 = fit automatically to the group). | 0 x 0 |
| Show topbar | Shows the top bar with the image type selector, brightness control, zoom reset and fullscreen. | true |
| Show footbar | Shows the bottom bar with the visibility toggles. | true |
| Show mask checkbox | Shows a checkbox in the bottom bar to toggle mask visibility. | true |
| Show bbox checkbox | Shows a checkbox to toggle bounding box visibility. | true |
| Show annotations checkbox | Shows a checkbox to toggle the bounding box labels. | true |
| Show polygon checkbox | Shows a checkbox to toggle polygon visibility. | true |
| Show result on canvas | Shows a small card to the left of the canvas with the analysis result (OK/NOK or a custom label). | true |
| Result card title | Title shown on the result card (only visible if "Show result on canvas" is enabled). | "Details" |
| Capture canvas | Automatically captures the canvas as an image and sends it to the output. | false |
| Image types | Number of image types to display (0-9). All types are editable. | 0 |
| Type names | Names of the image types for dynamic loading. They must match the keys of payload.imageShow. | [] |
Additional internal property:
order(order within the group,0by default).
Input
This node has 1 input. The node only stores the message when the payload includes one of these keys: imageShow, imageData, imageDataUnwrap, videoShow, videoData, bbox or polygons.
Images by type — payload.imageShow is an object whose keys match the configured type names. imageData accepts a Base64 string (data:image/...;base64,...) or a URL.
Within each type, imageDataMask is optional and bbox holds the bounding boxes. In each box, x_rel, y_rel, w_rel and h_rel are the relative position and size in the 0-1 range; color, tag, score, strokeWidth (stroke width) and fontSize are optional.
At the top level, result is the result status and determines the card colour, isAnomalous indicates whether the image contains anomalies, date is the date or ISO timestamp, and tag is the label shown on the card when isAnomalous is not defined.
msg.payload = {
    imageShow: {
        "type1": {
            imageData: "data:image/jpeg;base64,/9j/4AAQSkZJRg...",
            imageDataMask: "data:image/jpeg;base64,...",
            bbox: [
                {
                    x_rel: 0.1,
                    y_rel: 0.2,
                    w_rel: 0.3,
                    h_rel: 0.4,
                    color: "red",
                    tag: "defect",
                    score: 0.95,
                    strokeWidth: 5,
                    fontSize: 20
                }
            ]
        }
    },
    result: "NOK",
    isAnomalous: true,
    date: "2024-01-15T10:30:00Z",
    tag: "defect"
};Segmentation polygons — msg.polygons (optional), an array of polygons with relative points (0-1).
| Property | Description |
|---|---|
points | [x_rel, y_rel] pairs with relative coordinates in the 0-1 range. |
color | Colour in rgb(r,g,b) format. |
tag | Class label (optional). |
confidence | Confidence between 0 and 1 (optional). |
alpha | Fill transparency (optional, 0.5 by default). |
msg.polygons = [
    {
        points: [[0.58, 0.59], [0.59, 0.60]],
        color: "rgb(116,37,162)",
        tag: "blister_nok",
        confidence: 0.95,
        alpha: 0.5
    }
];Configuration messages — they restore or set the widget state.
configViewport restores the viewport transform (zoom and position) for each image type:
msg.payload = {
    configViewport: {
        "type1": [1, 0, 0, 1, 0, 0],
        "type2": [1, 0, 0, 1, 0, 0]
    }
};configMasks (boolean) sets the mask visibility and configBrightness the brightness filter, in the range -1 to 1:
msg.payload = { configMasks: true };
msg.payload = { configBrightness: 0.5 };Output
This node has 1 output. It emits messages in response to user interactions and to the canvas capture:
| Situation | Emitted payload |
|---|---|
| Mask visibility is toggled from the bottom bar. | { showMasks: true } or false |
| Box visibility is toggled from the bottom bar. | { showBboxes: true } or false |
| The brightness filter is applied from the top bar. | { brightness: 0.5 }, in the range -1 to 1 |
| The viewport transform is saved. | { configViewport: { ... } } |
| The canvas is captured as an image, only if "Capture canvas" is enabled. | { canvasCapture: "data:image/webp;base64,..." }, in WebP Base64 |
| Lines are saved with their coordinates. | { action: "save-lines", lines: [ ... ] } |
The viewport transform is emitted with one entry per image type:
msg.payload = {
    configViewport: {
        "type1": [1, 0, 0, 1, 0, 0],
        "type2": [1, 0, 0, 1, 0, 0]
    }
};And the saved lines, with their relative coordinates:
msg.payload = {
    action: "save-lines",
    lines: [
        { lineId: "line1", coords: { startX: 0.1, startY: 0.2, endX: 0.8, endY: 0.9 } }
    ]
};Usage example
Sending an image with several types, bounding boxes and a result status for visual inspection:
msg.payload = {
    imageShow: {
        "raw": {
            imageData: "data:image/jpeg;base64,/9j/4AAQSkZJRg...",
            imageDataMask: "data:image/jpeg;base64,...",
            bbox: [
                {
                    x_rel: 0.1,
                    y_rel: 0.2,
                    w_rel: 0.3,
                    h_rel: 0.4,
                    color: "red",
                    tag: "defect",
                    score: 0.95,
                    strokeWidth: 5,
                    fontSize: 20
                }
            ]
        },
        "processed": {
            imageData: "data:image/jpeg;base64,..."
        }
    },
    result: "NOK",
    isAnomalous: true,
    date: "2024-01-15T10:30:00Z"
};
return msg;To configure the image types, set how many types to use in "Image types" (for example, 2) and enter their names (raw, processed). These names must match the keys of payload.imageShow so the top bar selector switches between the views correctly.