

Session Info
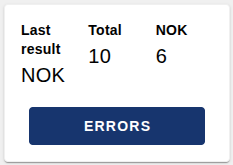
The Session Info node is a widget for Node-RED Dashboard 2 that displays session statistics and error information with interactive dialogs for detailed analysis. It presents an overview with the total counter, the error/anomaly counter, the status of the last result and the detailed error breakdown.
Clicking the error counter opens a dialog with a table showing the error breakdown. It supports both a simple format ({"error_name": count}) and a complex one ({"error_name": {"metric1": value1}}), with automatic detection of the table columns. It also includes session performance metrics with a timing breakdown.
Features
- Session overview: status of the last result (OK/NOK), total counter and error/anomaly counter.
- Detailed error analysis: interactive error counter dialog with a table view.
- Performance monitoring: session performance metrics with a timing breakdown.
- Customisable labels: every displayed label can be customised.
- Real-time updates: automatic data refresh from the incoming messages.
- Reset function: clears the session data through the reset command.
Configuration
| Property | Description | Default |
|---|---|---|
| Name | Node name shown in the editor. | '' |
| Group | Dashboard group where the widget is displayed. | (required) |
| Size | Widget width and height (0 = fit automatically to the group). | 0 / 0 |
| No Class Label | Label of the error counter field (text of the noClassCounter card). | 'Errors' |
| Param Label | Label of the first column of the error table (error name). | 'Errors' |
| Counter Label | Label of the second column of the error table (count). | 'Count' |
| Last Result Label | Label of the last result field. | 'Last result' |
| Card Title | Title of the session details card. | 'Session Details' |
Input
This node has 1 input. It is processed according to the contents of msg.payload.
Session data. When msg.payload is an object, it updates the statistics displayed by the widget:
| Property | Type | Description |
|---|---|---|
isAnomalous | boolean | Indicates whether an anomaly was detected. |
tag | string | Result label. |
totalCounter | number | Total number of predictions or items. |
anomalyCounter | number | Number of anomalies or errors. In the legacy format it is called noClassCounter. |
errorCounter | object | Detailed error breakdown. Each entry can be a number or an object with additional metrics, such as count and severity. |
performance | object | Performance metrics. milliseconds is the total processing time; jimp_read, convert and classify break down the loading, conversion and classification of the image. |
msg.payload = {
    isAnomalous: true,
    tag: "NOK",
    totalCounter: 150,
    anomalyCounter: 12,
    errorCounter: {
        "Label Misaligned": 5,
        "Insufficient Contrast": 3,
        "Blur Detection": {
            count: 4,
            severity: 0.8
        }
    },
    performance: {
        milliseconds: 1250,
        jimp_read: { milliseconds: 150 },
        convert: { milliseconds: 200 },
        classify: { milliseconds: 900 }
    }
};Reset. When msg.payload is the string "reset", all the session data is cleared:
msg.payload = "reset";Output
This node does not emit messages. It is a display-only component that shows the session information.
Usage example
Send an object with the session data to update the overview and the error breakdown:
msg.payload = {
    isAnomalous: true,
    tag: "NOK",
    totalCounter: 150,
    anomalyCounter: 12,
    errorCounter: {
        "Label Misaligned": 5,
        "Insufficient Contrast": 3,
        "Blur Detection": 4
    },
    performance: {
        milliseconds: 1250,
        jimp_read: { milliseconds: 150 },
        convert: { milliseconds: 200 },
        classify: { milliseconds: 900 }
    }
};
return msg;To clear the accumulated statistics, send the reset command:
msg.payload = "reset";
return msg;