

Chart Line
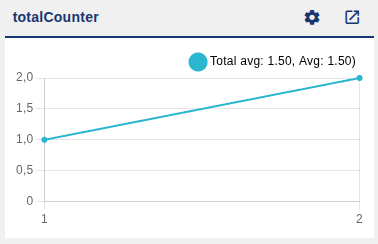
The Chart Line node displays time series data as interactive line charts, with configurable options for variable selection and history management. It can show one or two variables at the same time through dynamic selection.
Besides accepting already-formatted data, the node can process generic objects: it recursively extracts every numeric value it finds, accumulates their history and computes averages (current and total) that are shown in the chart legend.
Features
- Multi-variable display: shows one or two lines in the same chart.
- Dynamic variable selection: lets you choose which variables to display through dropdowns.
- Configurable history: sets the maximum number of data points to keep (5-1000).
- Fullscreen mode: expand button for a better view.
- Persistent configuration: the variable selection and settings are kept across reloads.
- Statistical calculations: the current and total averages are shown.
- Customisable labels: every interface label can be customised.
Configuration
| Property | Description | Default |
|---|---|---|
group | Dashboard group where the chart is displayed (required). | — |
name | Node name shown in the editor. | '' |
order | Widget order within the group. | 0 |
width | Widget width (0 = fit automatically to the group). | 0 |
height | Widget height (0 = fit automatically). | 0 |
chartTitle | Title shown at the top of the chart. | 'Parámetros' |
linesLabel | Label of the dropdown that selects between showing one or two lines. | 'Nº of lines' |
firstVarLabel | Label of the first variable selector. | 'Variable 1' |
secondVarLabel | Label of the second variable selector. | 'Variable 2' |
numberOfPointsLabel | Label of the field that configures how many data points to keep in the history. | 'Nº of points to save' |
saveButtonLabel | Text of the save button in the configuration dialog. | 'SAVE' |
Input
The node has 1 input. It interprets the message according to the contents of msg.payload:
Chart data (already formatted)
When msg.payload contains variables and labels, the data is sent straight to the chart. Within each variable, color and totalAverage (a precomputed average) are optional. labels holds the X axis labels, that is, the time points.
msg.payload = {
    variables: [
        {
            name: "Temperature",
            values: [22, 23, 24, 25, 26],
            color: "#2BB6D0",
            totalAverage: 24.0
        },
        {
            name: "Humidity",
            values: [60, 62, 65, 63, 64],
            color: "#E63b1f",
            totalAverage: 62.8
        }
    ],
    labels: ["1", "2", "3", "4", "5"]
};Generic object
If msg.payload is an object without variables/labels, the node walks its properties recursively and adds to the history every numeric value it finds (using the property path as the series name). There is special handling for tagCounter.OK.count and tagCounter.NOK.count.
msg.payload = {
    Temperature: 25,
    Humidity: 64
};The prefixes configViewport, configLineChartLength, configLineChart, configMasks and configTraining are excluded from this processing.
Line configuration
numberOfLines accepts the values 1 or 2. var2 is only needed when numberOfLines is 2.
msg.payload = {
    configLineChart: {
        numberOfLines: 2,
        var1: "Temperature",
        var2: "Humidity"
    }
};Maximum history length
configLineChartLength sets the number of points to keep, between 5 and 1000.
msg.payload = {
    configLineChartLength: 100
};Reset
The string "reset" clears all the chart data and resets the settings.
msg.payload = "reset";Output
The node has 1 output.
It forwards the chart update message when it receives already-formatted data (variables + labels), with topic: "chart-update":
msg.payload = {
    variables: [...],
    labels: [...]
};
msg.topic = "chart-update";When "reset" is sent, it emits a message with empty data:
msg.payload = { variables: [], labels: [] };From the interface, the widget also generates messages when the line configuration (payload.lineConfig) or the history length (payload.nodesMaxLength) changes.
Usage example
Basic usage
Send a single variable with its values and labels:
msg.payload = {
    variables: [
        {
            name: "Temperature",
            values: [22, 23, 24, 25, 26],
            color: "#2BB6D0"
        }
    ],
    labels: ["1", "2", "3", "4", "5"]
};
return msg;Multi-variable with configuration
First the data for the two variables is sent:
msg.payload = {
    variables: [
        { name: "Temperature", values: [22, 23, 24], color: "#2BB6D0" },
        { name: "Humidity", values: [60, 62, 65], color: "#E63b1f" }
    ],
    labels: ["1", "2", "3"]
};
return msg;And then the chart is configured to show both lines:
msg.payload = {
    configLineChart: {
        numberOfLines: 2,
        var1: "Temperature",
        var2: "Humidity"
    }
};
return msg;